
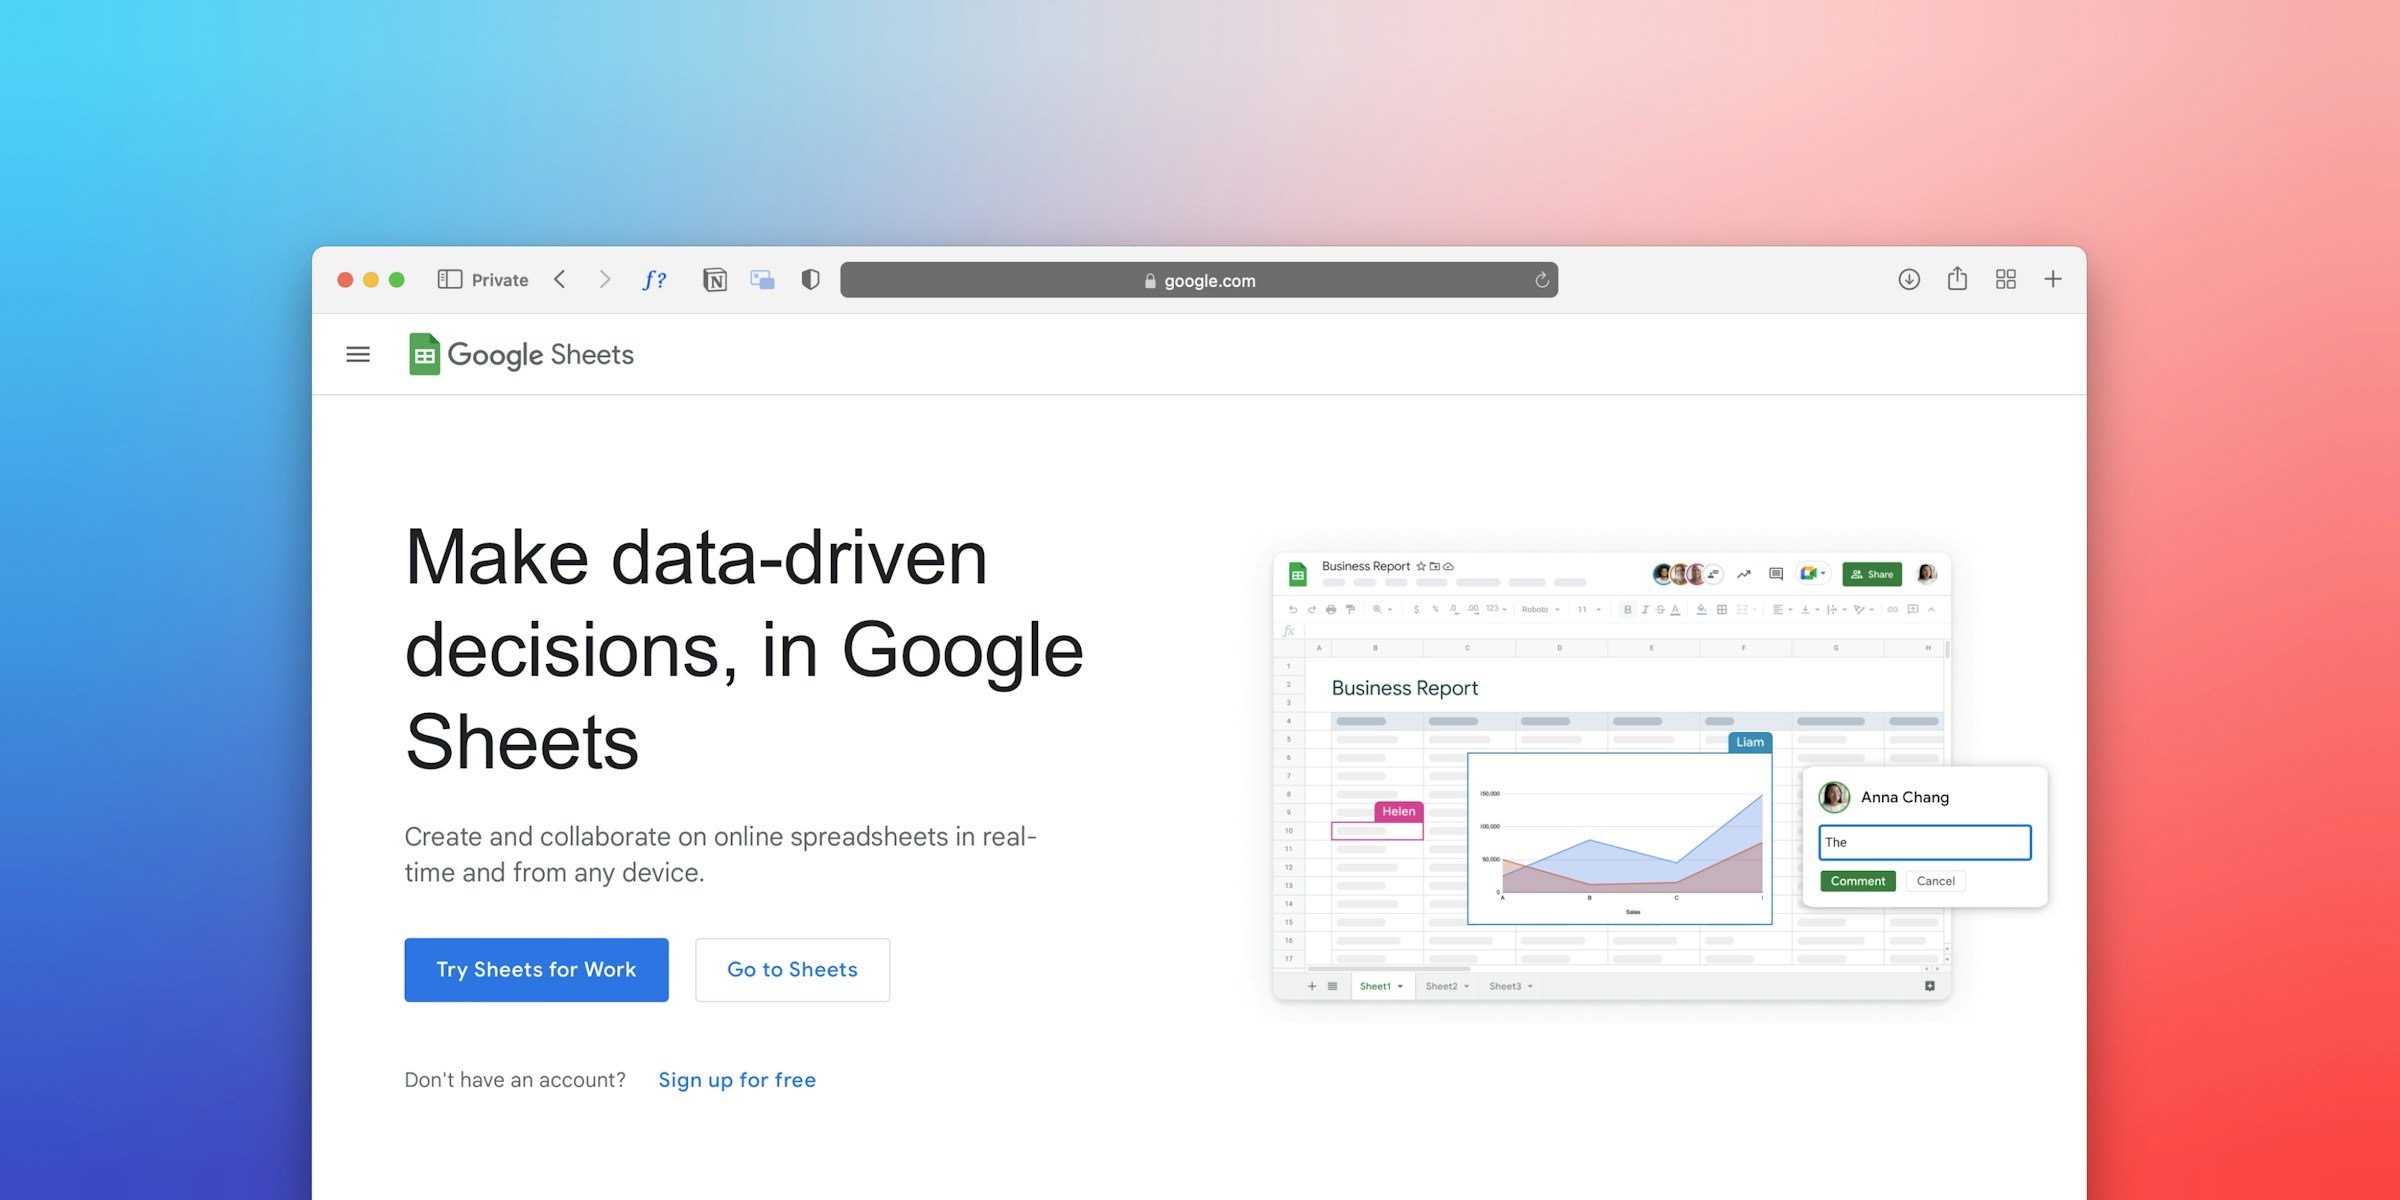
The popularity of online stock portfolio spreadsheets has allowed users to track their finances personally. Google Sheets is one such user-friendly application that provides investors with high-level information about their stock holdings.
Unlike other online spreadsheets, Google Sheets links smoothly with Google Finance, a valuable resource for information, real-time data, and investment tracking. With these compatible tools in hand, investors can harness raw data to get a clear picture of where their investments have been and where they may be headed.
This post will take a closer look at Google Sheets and Google Finance alerts and how you can take advantage of these powerful (and completely free) platforms to get daily updates about the performance of your investments.
Key Features of Google Sheets
One reason Google Sheets is such a handy tool is that it works with Google Finance to import data about stock prices and company information. Aside from the initial setup and occasional changes to your portfolio, you don’t have to enter any information manually.
Here are some of Google Sheets’ unique features that you can leverage for your investment efforts.
Financial Functions
Google Sheets has several features that are exclusive to the software. Besides its easy link to Google Finance using the =GOOGLEFINANCE function, Sheets also makes use of the XIRR function.
XIRR figures the internal rate of return (IRR) for variable cash flows, going beyond the basic IRR function of assuming equal intervals. Investors make stock transactions at various times, not just monthly or yearly. XIRR takes some of the guesswork out of irregular intervals to give users a more accurate overview of their investments.
Visualization
Google Sheets offers multiple options for visualizing your finances. You can create basic line and bar charts, along with candlestick charts that display a commodity’s open, high, low, and closing prices over a single day. Additionally, the platform offers a range of dashboards you can customize to suit your specific purposes.
Visualizations like these allow you to track portfolio performance, asset allocation, and current stock trends in clear, easy-to-understand ways.
Sharing and Collaboration
You can share your Google Sheets data with other partners or collaborators so they can get real-time info about your portfolio. By making use of cloud storage, you can access your portfolio from any device. Even better, Sheets automatically saves changes, so you aren’t at risk of losing data.
Google Alerts
While Google Finance doesn’t offer alerts of its own, you can leverage Google Alerts to get instant news and update your stock positions. For example, you can set up alerts with a company’s name or stock ticker and combine it with terms like “price increase” or “earnings report” to generate automatic messages.
Cost-Effectiveness and Flexibility
Of course, one of the biggest reasons Google Sheets is gaining popularity is its low cost — absolutely nothing. Despite being free, the application’s open-ended flexibility allows you to create custom formulas to make complex calculations. You can also take advantage of extensions to give yourself even more functionality.
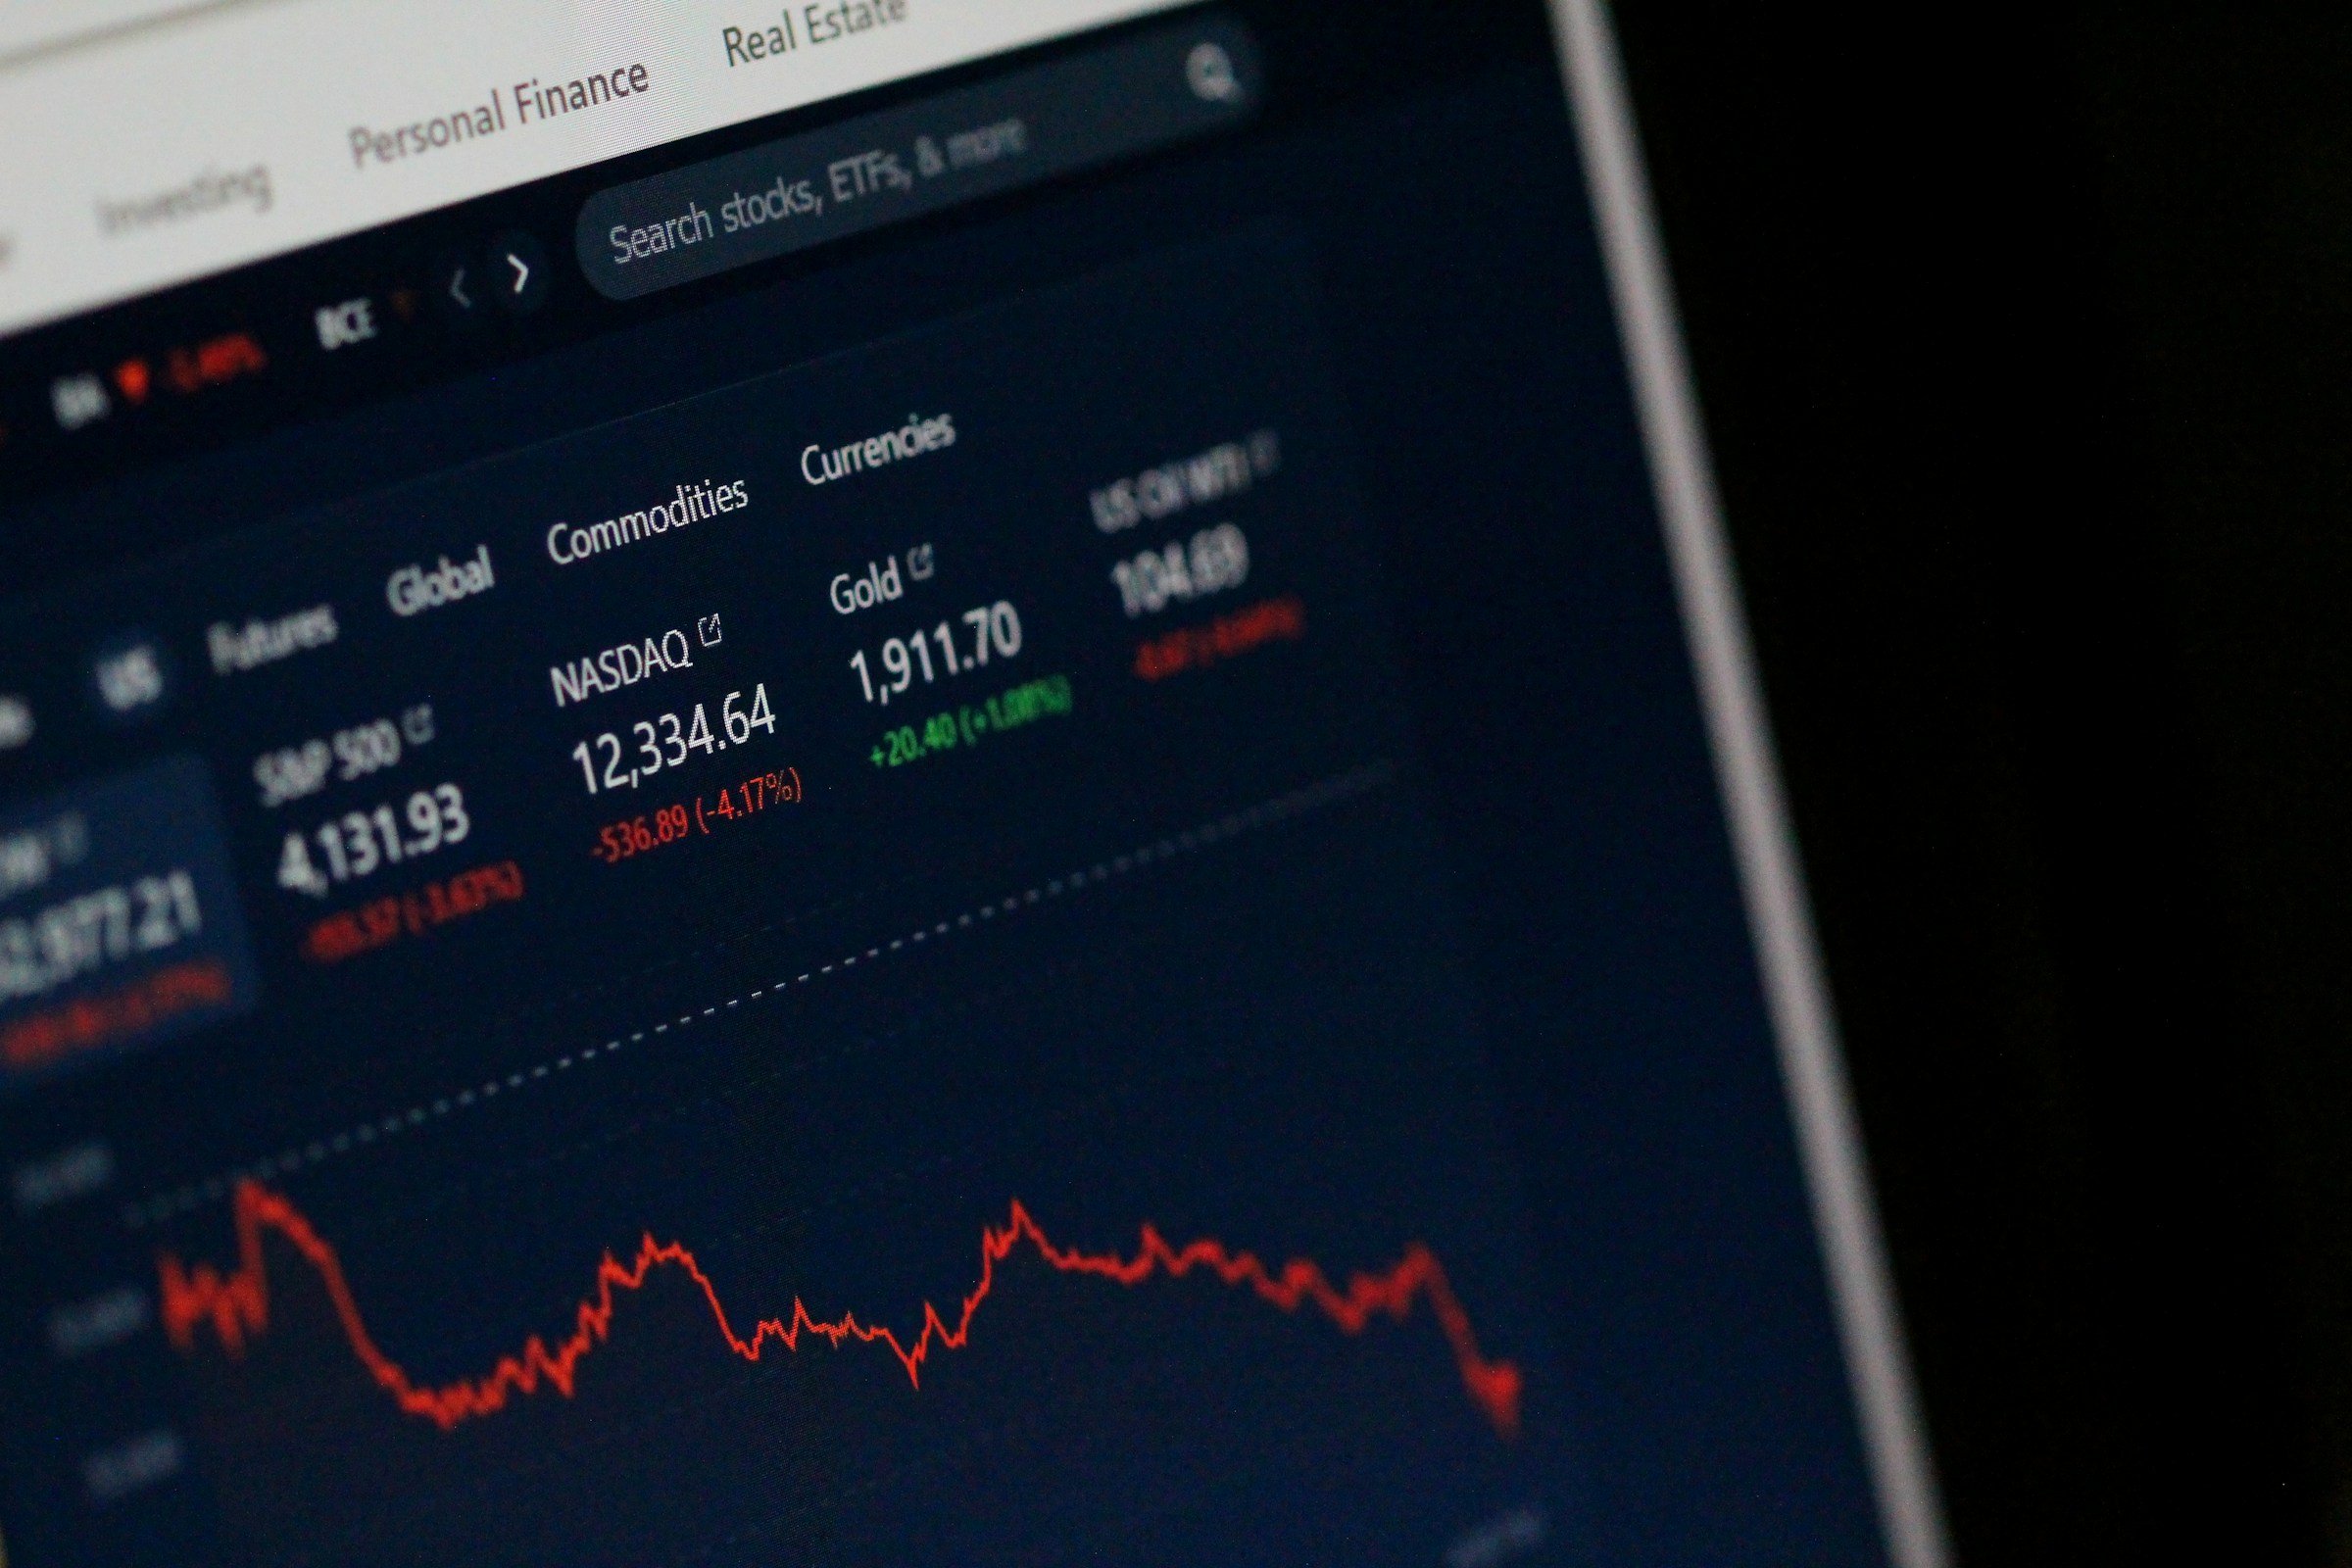
Google Finance Functionality
Google Sheets integrates with Google Finance, a one-stop shop that imports and manages real-time stock data and quotes. It can generate opening prices, daily highs and lows, market capitalization, and trading volume in an easily digestible interface.
The following are some of Google Finance’s stronger features.
Company Information
Google Finance offers detailed information about the specific companies you invest in. You can review news, financial statements, and other key statistics about the commodities in your portfolio.
Tracking and Analysis
You can create watchlists that track your stock market tickers and build stock portfolio spreadsheets to track how your positions perform.
The only drawback is that Google Finance doesn’t currently connect to any brokerages, so you’ll have to enter your positions manually. From there, however, Google Finance constantly updates information to give you the latest data.
Seamless Integration
Google Finance connects to all other components of the Google ecosystem, including Gmail and Search. This integration empowers investors with easier access to news and price alerts as they happen.
How to Use Google Sheets’s Stock Portfolio Spreadsheets
Using Google Sheets to create stock portfolio spreadsheets is easy. Depending on how many portfolios you want to track, it’s also relatively quick. Here’s a step-by-step breakdown of how to get set up.
1. Create a New Sheet or Open an Existing One
After launching the application, begin by creating a new file or opening a previously created spreadsheet. Don’t forget that you can import data into Sheets from a variety of sources, including your computer and Drive.
2. Give the Sheet a Name
This step is surprisingly important — you don’t want to be unable to find files because their names are confusing or vague. Name your sheet something simple and transparent, like “Stock Performance Portfolio,” “ETF Tracking,” “Healthcare Stock Portfolio,” or whatever reflects its contents.
3. Define Your Data in Column Headers
Decide which data points you want to track, such as ticker Symbol, number of shares, current price, P/E ratio, and so on. You can keep up with literally any type of information on the stock, though some may require you to enter additional formulas.
4. Connect to Google Finance
Here’s where we really get moving. In each cell on your spreadsheet, type in the =GOOGLEFINANCE command, then use parentheses to identify the ticker symbol and the data you’d like to import.
For example, you might use the following data string to call in current data for Apple (AAPL): =GOOGLEFINANCE(“ticker symbol”, “data”). In the “ticker symbol” string, you would simply type “AAPL.”
You can use whatever data points you like in place of the string “data.” Here are just a few possibilities:
- Price: The current price of the stock
- Change: The difference between the current price and the last closing price
- High, Low: The highest and lowest price for the stock during the day
- Volume: The total shares traded during the day
- PE: The current price-to-earnings (P/E) ratio
- Market Cap: The stock’s current total value of outstanding shares
You can also use the =GOOGLEFINANCE command to generate historical data. For example, if you wanted Apple’s trading volume on March 7, 2023, you’d enter =GOOGLEFINANCE(“AAPL”, “volume”, DATE(2023, 03, 07)). Some data points may not have historical information, so take the time to learn what’s available.
You can repeat the formula across different stock tickers by simply dragging the =GOOGLEFINANCE command across rows where you have other stock holdings.
5. Use Automatic Calculations
Google Sheets has many shortcuts for making quick calculations. For instance, if you’re tracking a stock’s current price in cell D2 and your purchase price in cell E2 and you want to know the difference between them, you’d enter the formula =(D2-E2) in an adjacent cell.
6. Customize and Enrich Data
Take some time to get familiar with the ways Google Sheets can enhance your data. Some common customizations include:
- Making positive numbers green and negative numbers red
- Bolding cells that exceed a certain gain/loss percentage threshold
- Creating charts and graphs to represent your portfolio’s growth over time
- Searching for extensions and add-ons for more functionality
There are countless other ways you can present your data using =GOOGLEFINANCE, so don’t be afraid to think outside the box (or cell, as it were).
7. Maintain Your Information
Google Sheets automatically updates your files as you work on them. To keep information fresh, manually refresh the current prices by right-clicking on a cell and choosing “Get external data.”
Gorilla Trades: Putting the Power of Data in Your Hands
Data is king at Gorilla Trades. We help our clients gain access to the best research tools, content, tutorials, and other resources to make them more confident traders. We’ll even show you how to make stock portfolio spreadsheets on your own.

Start a 30-day free trial and we’ll give you a month’s worth of stock tips absolutely free.

